
Affinity Diagram
An Affinity Diagram is a tool that
gathers large amounts of language data (ideas, opinions, issues) and organizes them
into groupings based on their natural relationships.
The Affinity process is often used to group ideas generated by
Brainstorming.
The Affinity process is a good way
to get people to work on a creative level to address difficult issues. It may
be used in situations that are unknown or unexplored by a team, or in
circumstances that seem confusing or disorganized, such as when people with
diverse experiences form a new team, or when members have incomplete knowledge
of the area of analysis.
The Affinity process is formalized in an
Affinity Diagram and is useful when you want to:
·
Sift through large volumes of
data. For example, a process owner who is identifying customers and
their needs might compile a very large list of unsorted data. In such a case,
creating an Affinity Diagram might be helpful for organizing the data into
groups.
·
Encourage new patterns of thinking.
An Affinity exercise is an excellent way to get a group of people to react on a
"gut level" rather than mulling things over intellectually. Since
Brainstorming is the first step in making an Affinity Diagram, the team
considers all ideas from all members without criticism. This stimulus is often
enough to break through traditional or entrenched thinking, enabling the team
to develop a creative list of ideas.
As a rule of thumb,
if less than 15 items of information have been identified; you can skip the
Affinity process. Instead, you can clarify and combine the ideas and then use
one of the Decision-Making Tools to identify the highest priority items.
Creating
Affinity Diagram
Affinitizing is a process performed
by a group or team. The idea is to meld the perspectives, opinions, and
insights of a group of people who are knowledgeable about the issues. The
process of developing an Affinity Diagram seems to work best when there are no
more than five or six participants. Before we go over the steps used to create
an Affinity Diagram, we need to look at some unique features of the Affinity
process that are important to its success:
·
Affinitize silently.
The most effective way to work is to have everyone move the displayed
ideas at will, without talking.
This is a new experience for many people. It has two positive results: It
encourages unconventional thinking (which is good), while it discourages
semantic battles (which are bad). It also helps prevent one person from
steering the Affinity.
·
Go for gut reactions.
Encourage team members not to agonize over sorting but to react quickly
to what they see. Speed rather than deliberation is the order of the day, so keep
the processes moving.
·
Handle disagreements simply.
The
process provides a simple way to handle disagreements over the placement of
ideas: If a team member doesn’t like where an idea is grouped, he or she moves
it. This creates an environment in which it is okay to disagree with people
having a different viewpoint. If consensus cannot be reached, make a duplicate
of the idea and place one copy in each group.
Step-by-step
process of creating an Affinity Diagram
(Adapted from the The
Memory Jogger):
Step 1 - Generate
ideas.
Use the Brainstorming tool to generate a list of ideas.
The rest of the
steps in the Affinity process will be easier if these ideas are written on
post-its.
Step 2 - Display the
ideas.
Post the ideas on a chart pack, a wall, or a table in a random manner.
Step 3 - Sort the
ideas into related groups. The team members physically sort the cards into groupings,
without talking, using the
following process:
·
Start by looking for two ideas that seem related in some way. Place them
together in a column off to one side.
·
Look for ideas that are related to those you've already set aside and
add them to that group.
·
Look for other ideas that are related to each other and establish new
groups. This process is repeated until the team has placed all of the ideas in
groups.
NOTE: Ideally, all of the ideas can be sorted into
related groups. If there are some "loners" that don’t fit any of the
groups, don’t force them into groupings where they don’t really belong. Let
them stand alone under their own headers.
Step 4 - Create
header cards for the groups. A header is an idea that captures the essential link among the ideas contained in a
group of cards. This idea is written on a single card or post-it and
must consist of a phrase or sentence that clearly conveys the meaning, even to
people who are not on the team. The team develops headers for the groups by:
·
Finding already existing cards within the groups that will serve well as
headers and placing them at the top of the group of related cards.
·
Alternatively, discussing and agreeing on the wording of cards created specifically
to be headers.
·
Discovering a relationship among two
or more groups and arranging them in columns under a super header. The same rules apply for
super headers as for regular header cards.
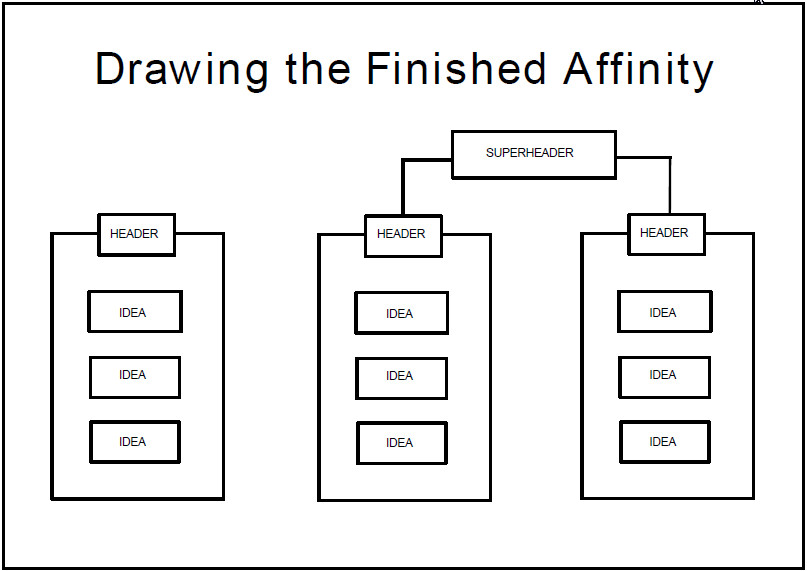
Step 5 - Draw the
finished Affinity Diagram.
1. Write a problem
statement at the top of the diagram.
2. Place header and
super header cards above the groups of ideas.
3. Review and clarify
the ideas and groupings.
4. Document the finished
Affinity Diagram.
How
can we practice what we’ve learned?
Some practical exercises will enable
you to apply the skills you've just learned.
These exercises are
intended to be done by a team with the assistance of a facilitator or
instructor. Everyone on the team should take an active part.
The first exercise takes you through
the Affinity process in detail, using viewgraphs to illustrate how the random
spread of cards might be grouped to arrive at a finished diagram. The diagram
provided is only an example. The important thing is that the finished diagram
should be one that everyone on your team can live with and support.
When you have completed the detailed
exercise, you may want to practice creating an Affinity Diagram for some of the
other topics listed after the exercise.
What are the issues in
implementing continuous process improvement?
Step 1- Generate
ideas.
Step 2 - Display the
ideas. Place the post-its on a chart pack, easel, or wall, in a random manner.

Step 3 - Sort the
ideas into related groups. Group the ideas by moving the cards
independently. Participants should go with their gut reactions. If they
disagree on the placement of a card, they are free to move it. The instructor
should remind them that affinitizing is a quick process conducted in silence.

Step 4 - Create
header cards. Make sure that each header placed at the top of a group captures the
essential link among all of the ideas beneath it and consists of enough words
to clearly convey the meaning. Refer to Viewgraph 8 for an example of header
cards that have been developed for this exercise—or have the participants
create their own.

Step 5 - Draw the
finished Affinity Diagram. Make sure you write the problem statement on top
of the diagram, place a header card above each group of ideas, allow the team
to review and discuss points for clarification, and document the finished
product. Refer to the completed Affinity in Viewgraph 9 for an example; but
remember, it's only an example. If the participants developed their own header
cards, the Affinity they create will be different.

Other Exercise Topic:
·
Now try developing an Affinity Diagram for one or more of these topics:
·
How can we improve the readiness of the command?
·
What can be done about the state of readiness of the fire control
systems?
·
Why is our ship dragging anchor in heavy weather?
·
What things do we need to consider in planning a perfect meeting?
·
What can be done to ensure proper disposal of recyclable material?
·
How can information flow be improved within our organization?
·
Why are the organization's vehicles getting poor gas mileage?
·
What can be done to ensure fast service at the pharmacy prescription
counter?
·
What activities should we plan for the unit Christmas party?
Affinity Diagram Example
Following diagrams show a simplified sample for our famous timely pizza
delivery problem.


No comments:
Post a Comment